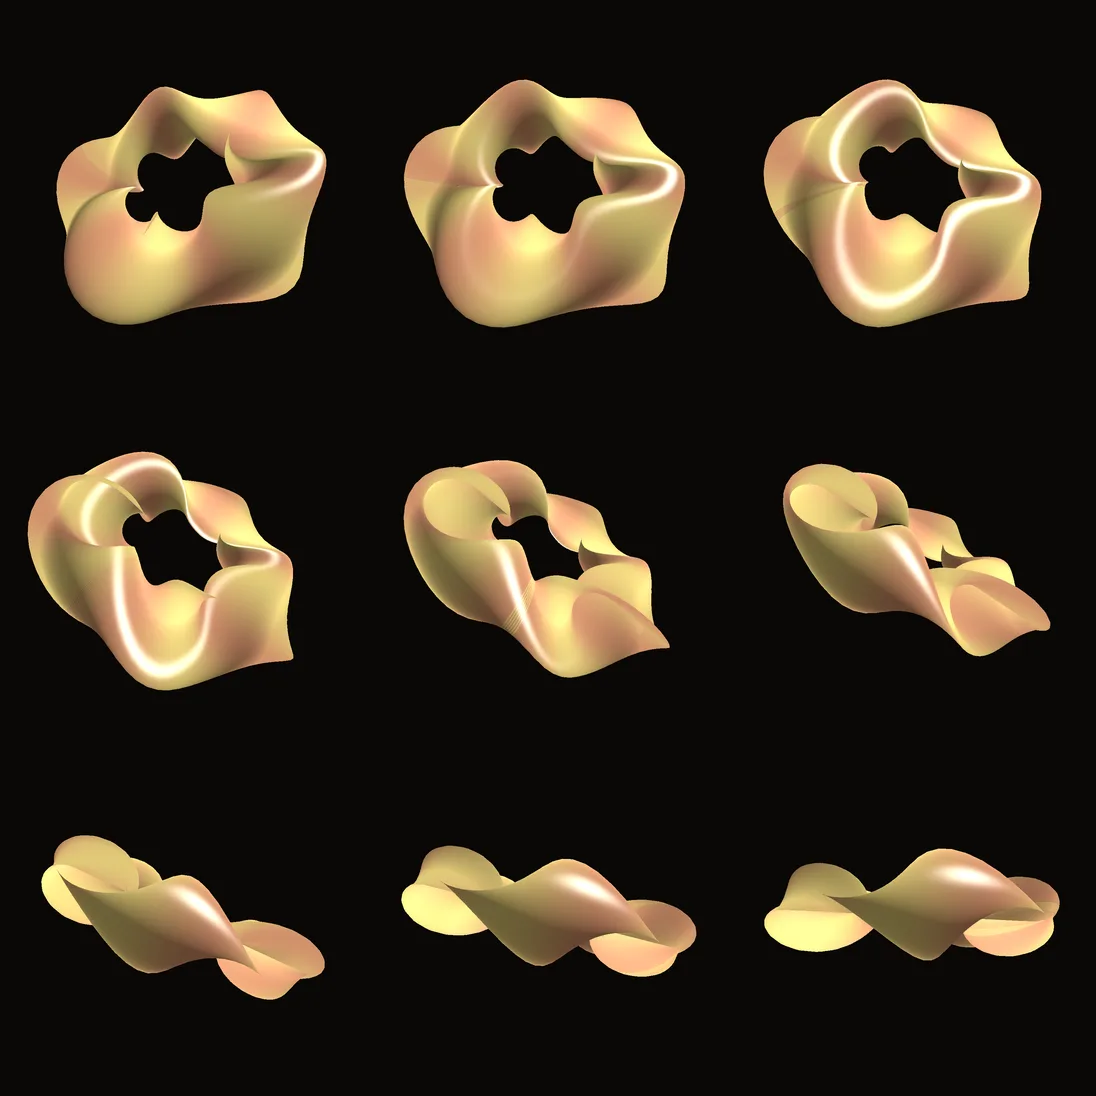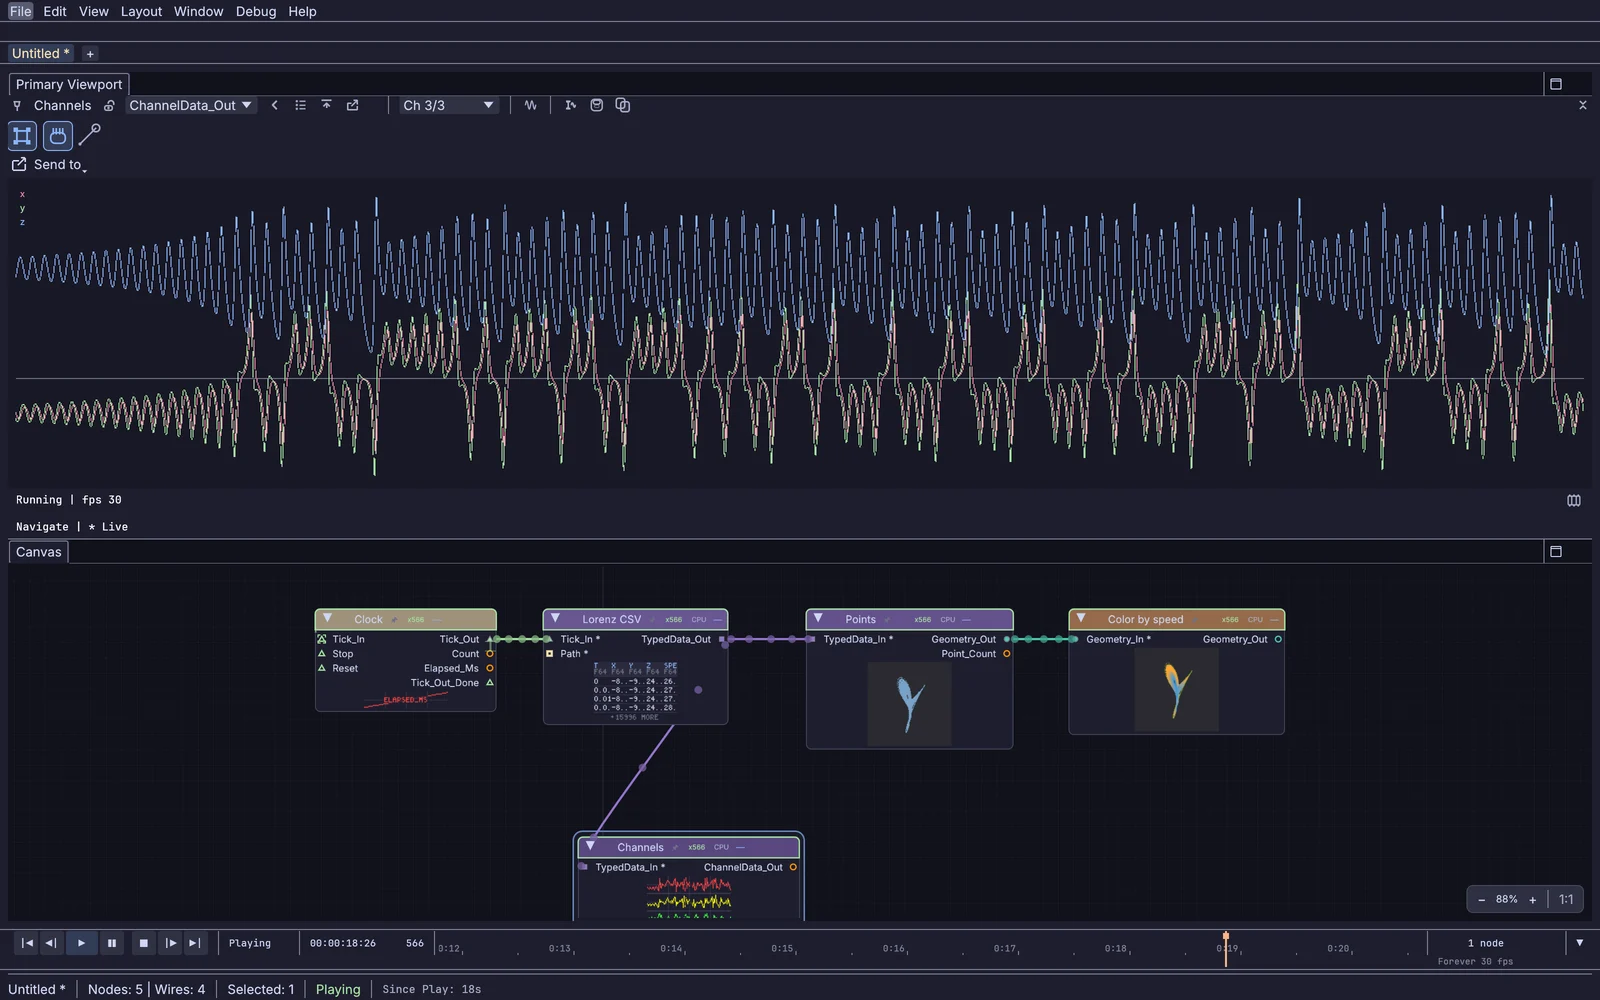
Kinematic 0.5.0 is out. Modeling and sculpting in the viewport, a timeline on every graph, photo and sound editing. What's new
Kinematic / Who it's for / Research and data visualization

Chart, track and show your data in Kinematic.

Open a CSV, a sensor on a serial port or a camera. Chart it, track people and rooms with models that run on your own machine, and script every run in Python with no window. Then put the result on a screen, a projector or a wall of lights.

  • Researchers
  • Data artists
  • Lab engineers
  • HCI researchers
  • Students
CSV, JSON, serial and OSC inModels run on your machineScripted runs with no windowFree
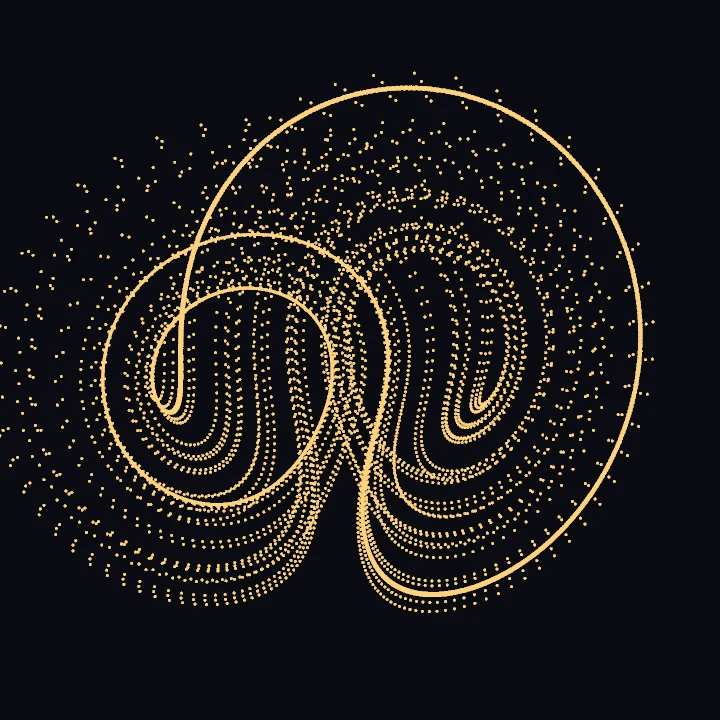
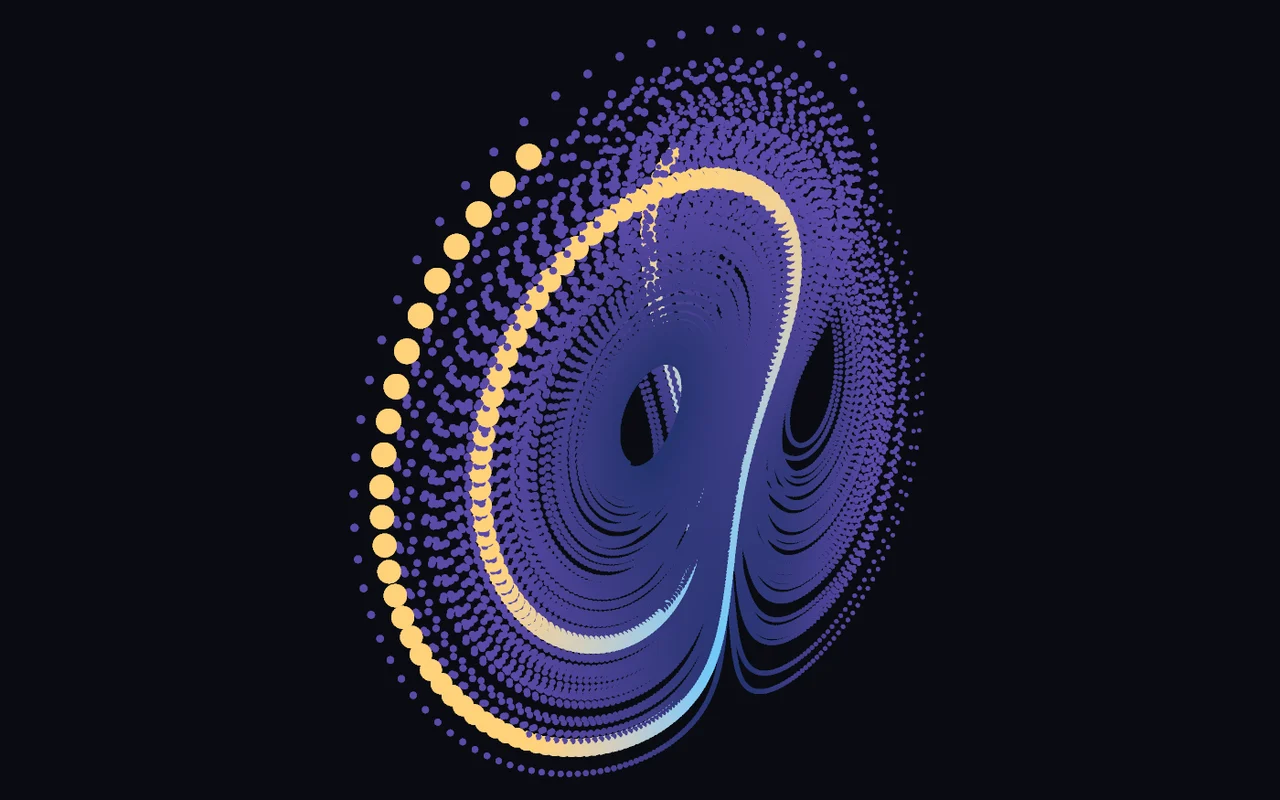
16,000 samples from a CSV drawn as points colored by speed, the latest stretch of the run in bright gold

Every picture on this page is the app's own output.

The work

What researchers make.

The jobs that come up week to week, and how each one is done here. Every step stays a node you can open again when the data or the question changes.

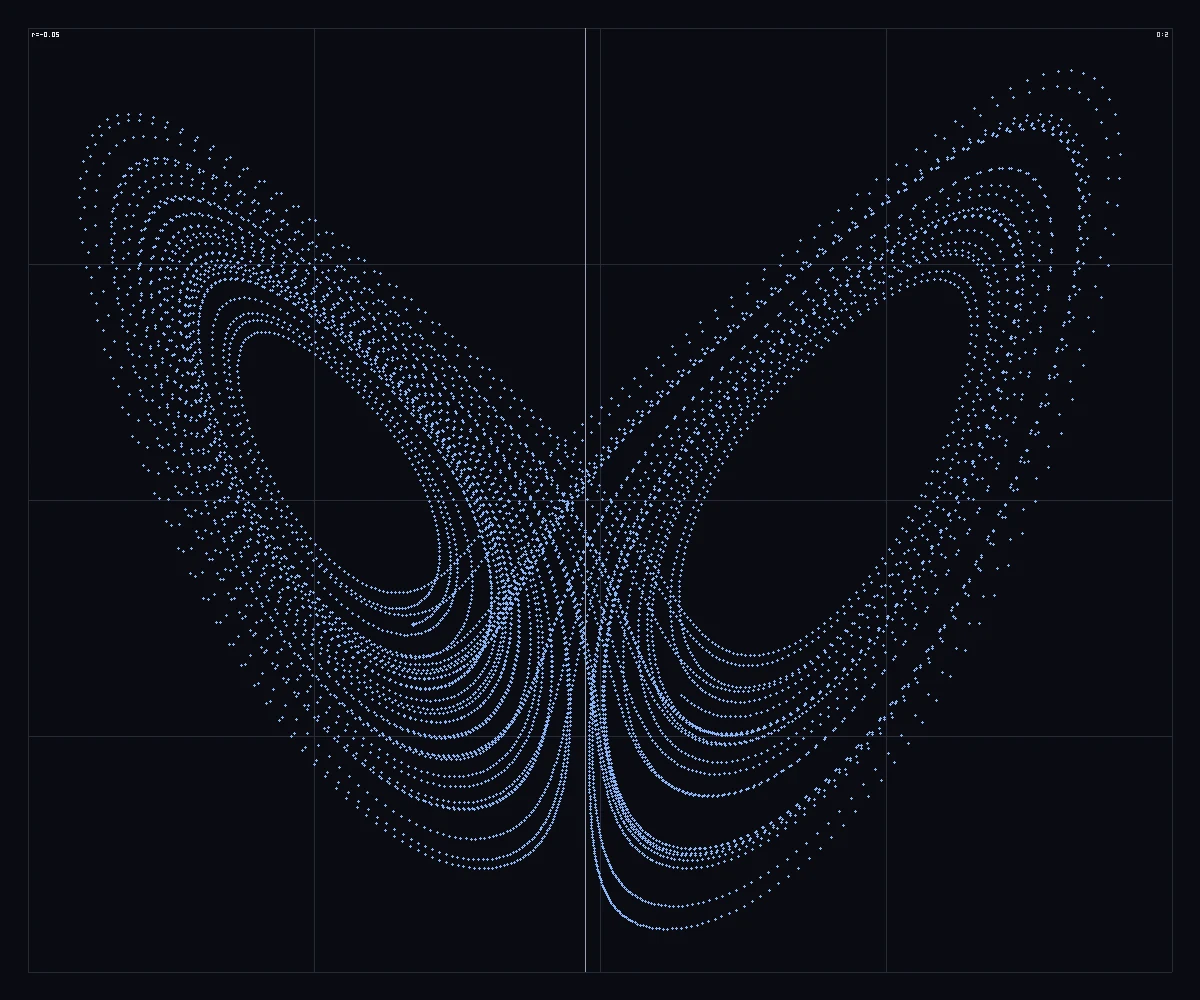
lorenz.csv opened in Kinematic: x, y and z drawn in the viewport, the graph that reads it below
01 · Data

Open a dataset and look inside it.

Open a CSV or JSON file, compressed CSV included, and let it reload on its own when a new export lands. Filter, sort and pivot a table, and roll groups up to sums, means, medians, standard deviations and percentiles. The viewport shows any table or channel as a table, a graph, a histogram or a summary.

TypedDataFileInTypedDataFilterTypedDataAggregateTypedDataPivot
What you getA clean table that updates when the data does.CSV and JSON tables →
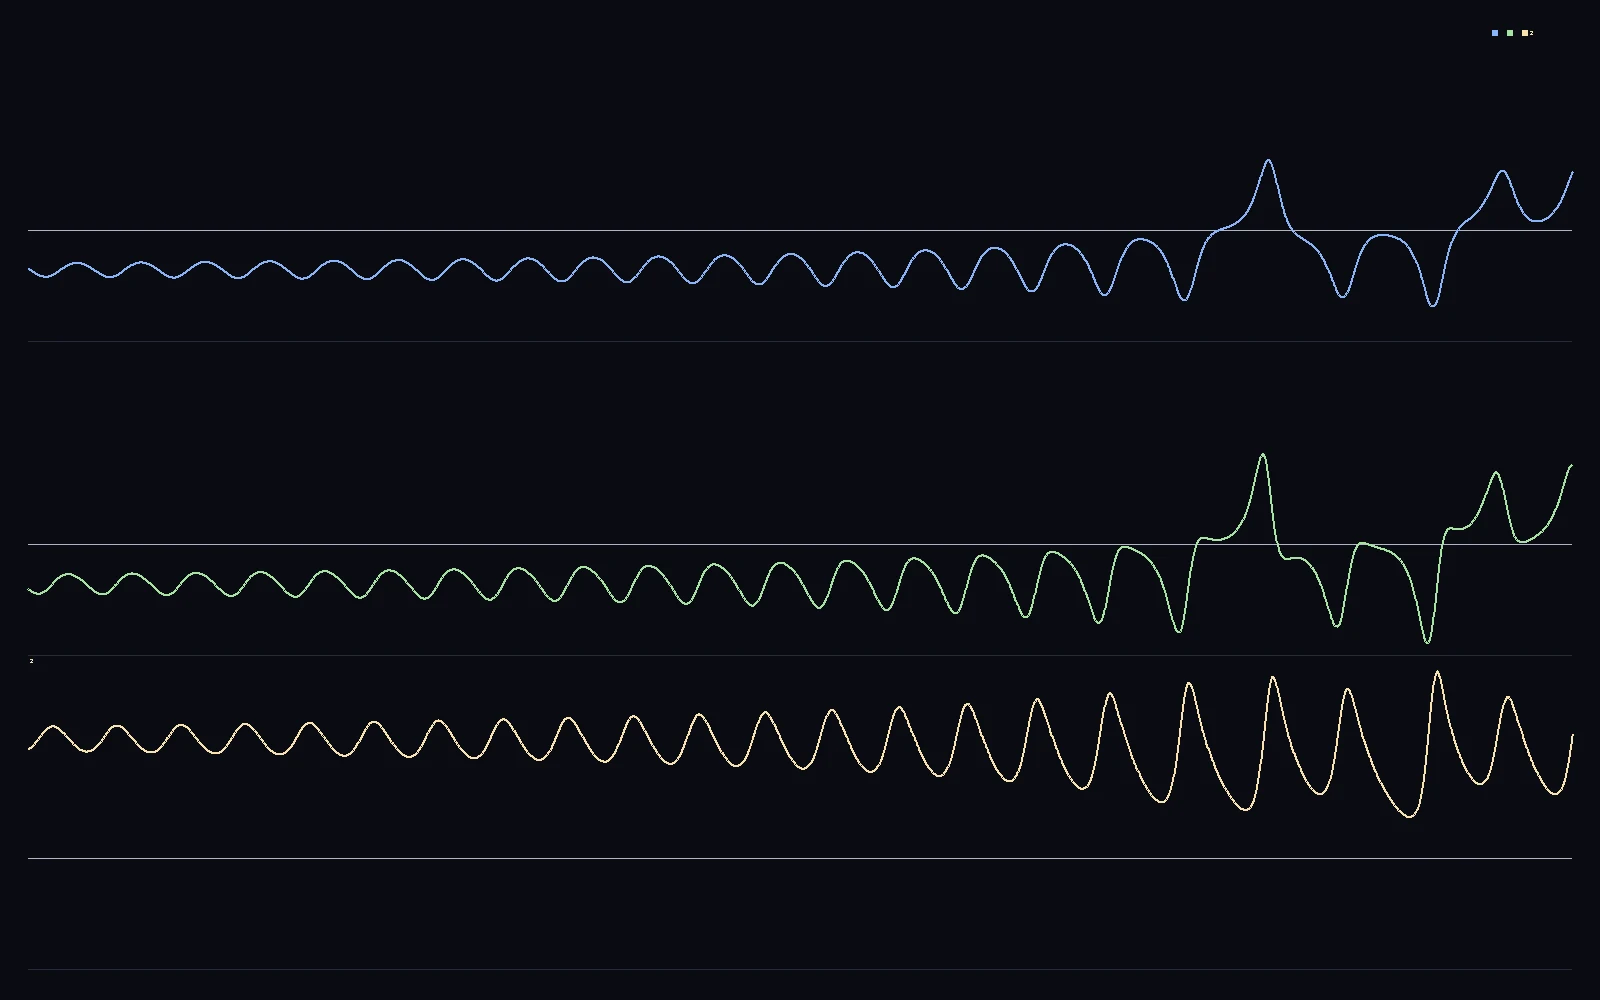
x, y and z of the run as stacked lanes
z against x as a scatter, with Pearson r in the corner
02 · Figures

Draw figures for a paper or a talk.

Plot channels as lines, stacked lanes, a scatter with its correlation, a histogram, a heatmap or a spectrum, up to 8192 pixels a side. Draw bar, pie and scatter charts as SVG. Save a still as PNG or TIFF with its print size in dpi, as float EXR, or as a numbered sequence for a video.

ChannelDataPlotSvgBarChartSvgScatterPlotOutputImageFile
What you getFigures that redraw when the numbers change.The viewport →
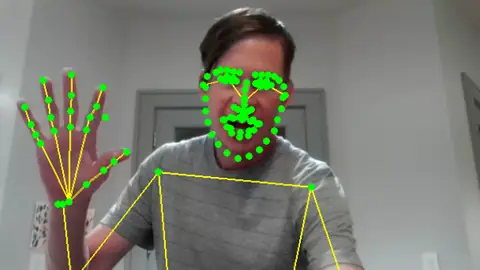
a dancer with the background dropped and the body tracked, read from a video file
03 · Studies

Track people in a study.

Find 17 body points per person, or 133 with the face, feet and hands, from an ordinary camera or a video file. Track moving blobs with steady IDs, draw zones to count who enters, leaves and stays, and build a heat map of where people went. The models run on your machine, so footage never leaves it.

LocalAIImageToBodyPoseLocalAIImageToWholeBodyPoseBlobZoneNodeBlobHeatMapNode
What you getJoint positions, counts and dwell times as tables.Track a body →
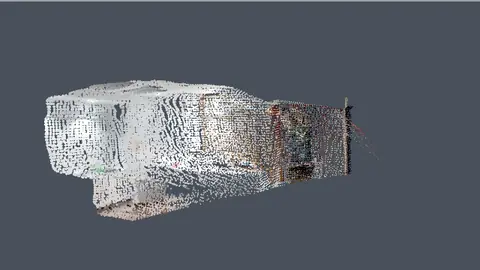
a room from one saved depth frame, rebuilt as colored points
04 · Spaces

Measure a room.

Read color, depth and IR from a depth camera, or work out depth from one webcam frame with a local model. Turn either into points, walk a camera through a room to map it, and measure area, perimeter and volume.

DepthCameraCaptureInterfaceLocalAIImageToDepth3DGeoDepthPointCloud3DGeoMeasure
What you getA point cloud you can measure and save as PLY.Turn a room into points →
a recorded speech turned into text by a local model, set as captions sentence by sentence
05 · Interviews

Transcribe interviews.

Play recorded interviews or a talk into a speech model on your own machine: a small one on a laptop, a large one on a graphics card. Pick the language or let it listen for one. It waits for a pause, so sentences are not cut in half.

InputAudioFileLocalAIAudioTranscribeTypedDataFileOut
What you getA transcript in a CSV, with no upload.Caption a talk live →
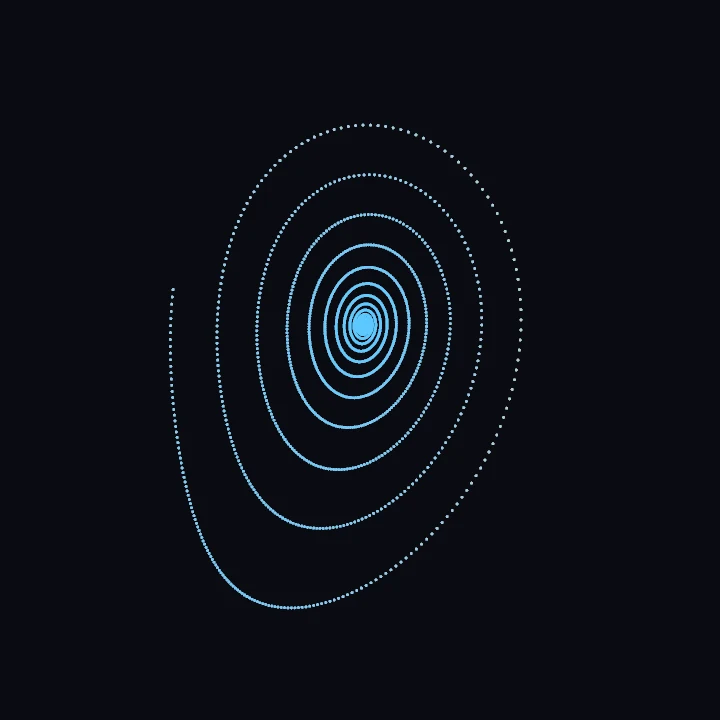
rho_14.png: the run spirals into one point
rho_14.png
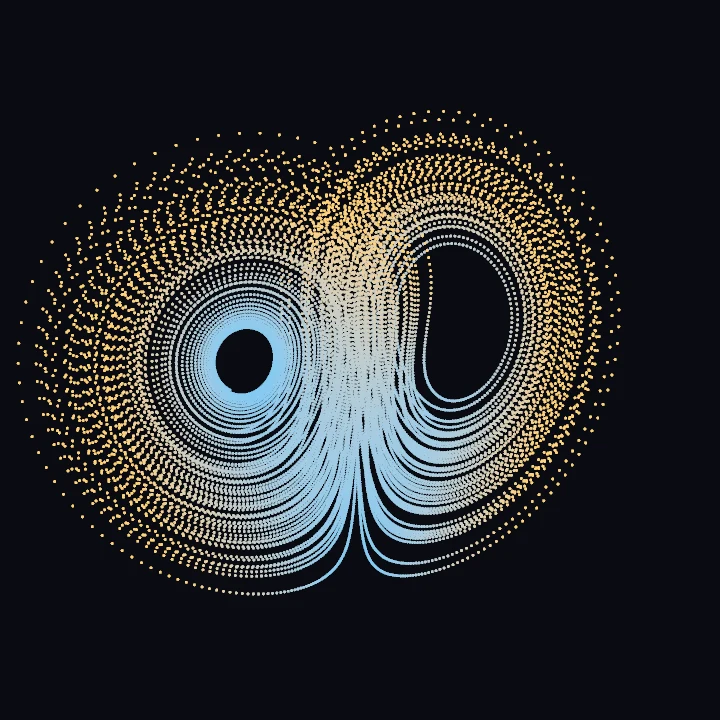
rho_28.png: the two-winged attractor
rho_28.png
rho_99.96.png: the run settles into one loop
rho_99.96.png
06 · Batches

Run every condition.

Run a graph once per file or once per value, every combination, each run its own process and as many at once as you allow. On the virtual clock a run steps itself one frame at a time, so the same graph does the same work at the same timestamps.

$ kinematic run lorenz_runs.kin \
    --each data.file_path='runs/*.csv' \
    --set out.file_path='out/{stem}.png' --jobs 3
What you getOne picture or table per condition, named after its input.The command line →
What you gain: sound

Turn data into sound.

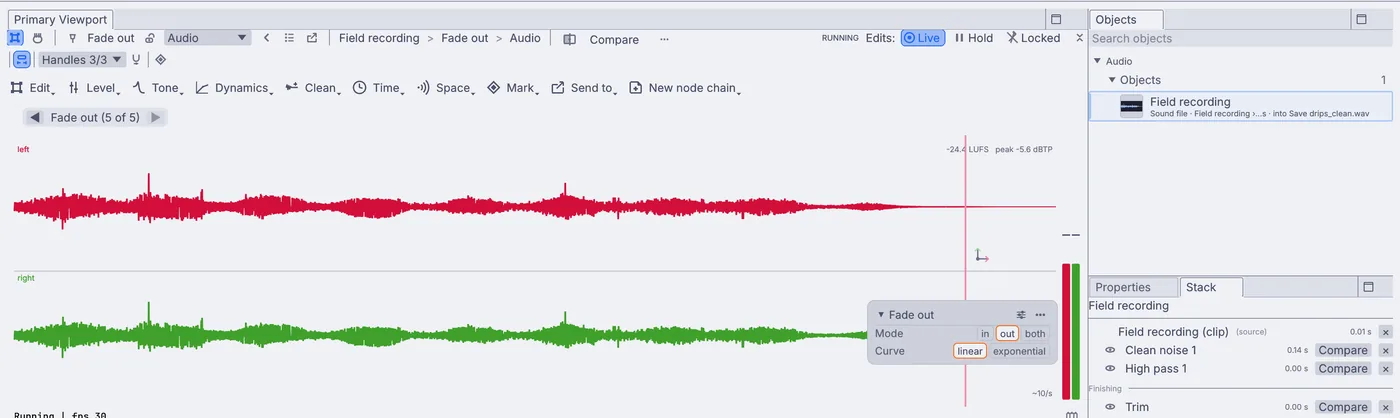
Sound lives in the same file as the data. Play a series as sound, let a channel steer a synth, or go the other way and read a recording as numbers you can chart and save.

  • A data series packed straight into audio, or a channel steering a synth, saved as a WAV file
    ChannelDataToAudioAudioOscillatorOutputAudioFile
  • A spectrum with its peak frequency, centroid and rolloff, and loudness in LUFS
    AudioSpectrumAudioLoudness
  • Pitch followed by a small model, and speech, music or noise marked as segments
    LocalAIAudioToPitchLocalAIAudioToSoundClass
  • Pictures that follow the sound: loudness and hits can drive any value in the graph
    AudioEnvelopeFollowerAudioOnsetDetect
ground raised by a song's bass, mids and treble, with the camera circling it
a song's spectrum moving as it plays
hits in a song counted as they happen
What you gain: live

Show it live.

The graph keeps running, so the file that charts the data can also put it in front of people: on a projector at a talk, across a wall of lights at an open day, or around a room in an exhibit.

  • Full screen on a second display or a projector, with the editor out of the way
  • Pictures shaped onto walls and objects, and lined up from the side
    ProjectionMapperImageCornerPin
  • Values driving lights over DMX and Art-Net, and pictures across a wall of LEDs
    ChannelDataToDmxImageToDmxArtNetSendInterface
  • A touch page any phone in the room can open, and pictures sent to other machines over NDI
    DmxRemoteEndpointStreamingNDISendInterface
one moving picture across three walls and the floor, with visitors inside, previewed in 3D
the editor stepping aside so the picture takes the whole screen
a pattern mapped onto 640 RGB lights over four DMX universes
What you gain: simulation

Simulate liquids, cloth and bodies.

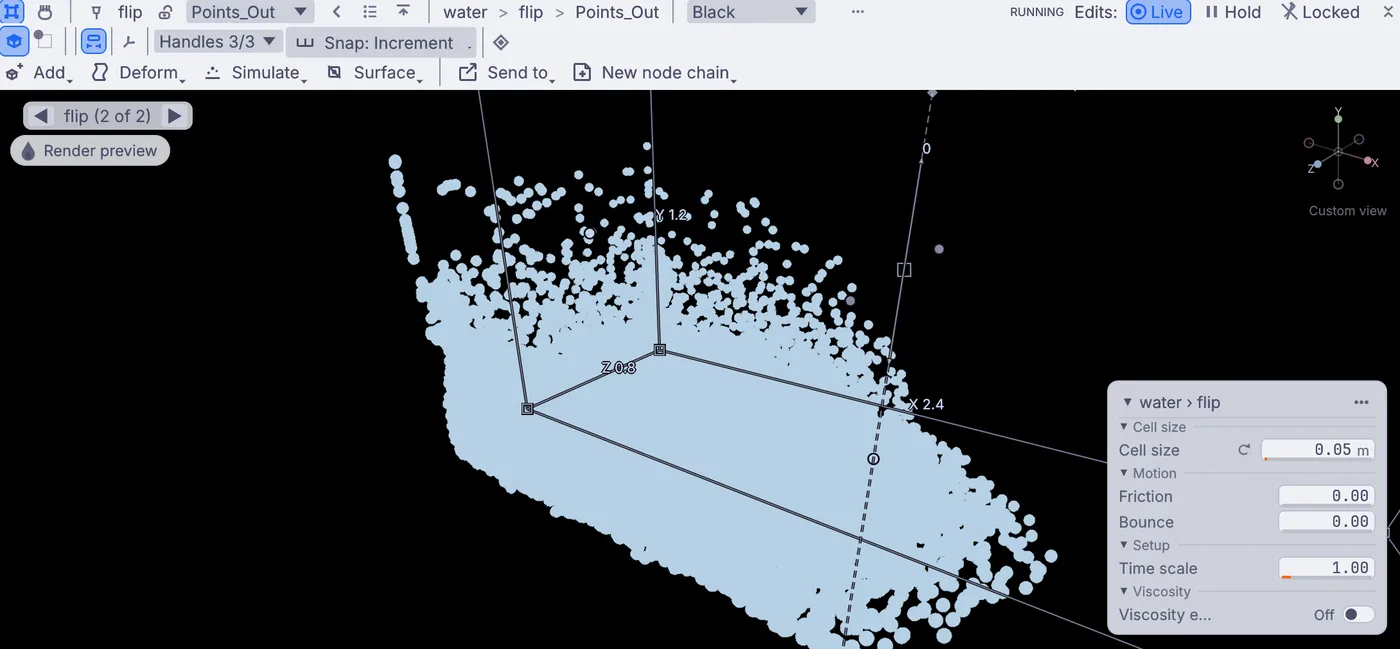
Build the system you are explaining and watch it run: water in a tank, bodies under gravity, a pattern growing out of two chemicals. Sweep any setting from the command line to cover the whole range.

  • Liquids from one solver node, thin as water or thick as mud
    3DGeoFlipSimpleSolver
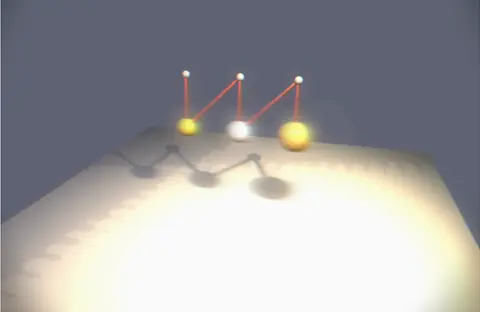
  • Rigid bodies with gravity, joints and motors
    PhysicsWorldPhysicsBodyPhysicsConstraint
  • Cloth, hair, grains and soft bodies in one solver
    PBDSimSolver
  • Particles under forces you add: gravity, swirl, attraction, drag
    3DGeoParticleChainEmitter3DGeoParticleChainVortex3DGeoParticleChainSolver
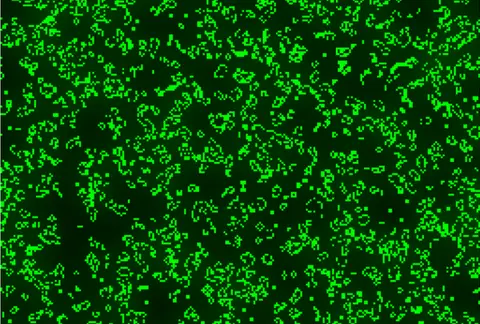
  • Gray-Scott reaction-diffusion and Conway's Life on a grid
    ImageReactionDiffusionImageCellularAutomaton
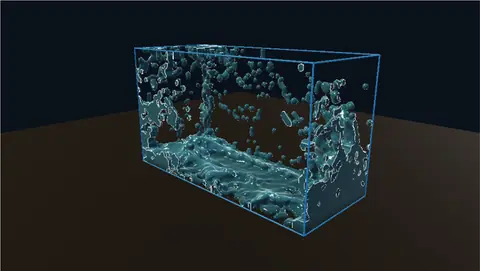
a dam break: the water lets go, hits the far wall and sloshes back
reaction-diffusion growing specks into dots and worms
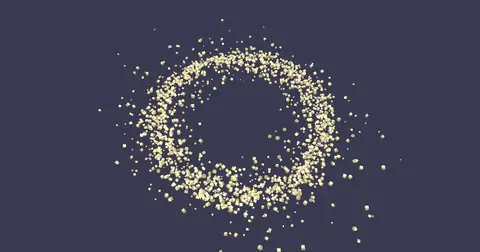
a ring of particles winding into two swirling whirlpools
What you gain: scans

Scan a site or an object.

Bring in a Gaussian splat or a point cloud of a site, a find or a specimen. Clean it up, check what it is made of, measure it and render it, or turn it into a solid mesh for other tools.

  • Splats from PLY, SPZ, SOG and .splat files, and the COLMAP solve they came from
    3DGeoImportPLY3DGeoImportSPZ3DGeoImportCOLMAP
  • Crop to the part you need and sweep away floating specks
    3DGeoSplatCrop3DGeoSplatPrune
  • A report on the cloud: count, bounds, memory and size histograms
    3DGeoSplatStats
  • A scan turned into a solid mesh, color and all, then measured
    3DGeoSplatToSurface3DGeoMeasure
a scanned lizard sculpture and the garden around it, the camera circling · scan by Niantic Labs, MIT license
a family of raccoons in a hollow stump, cut out of the yard it was scanned in · scan by Niantic Labs, MIT license
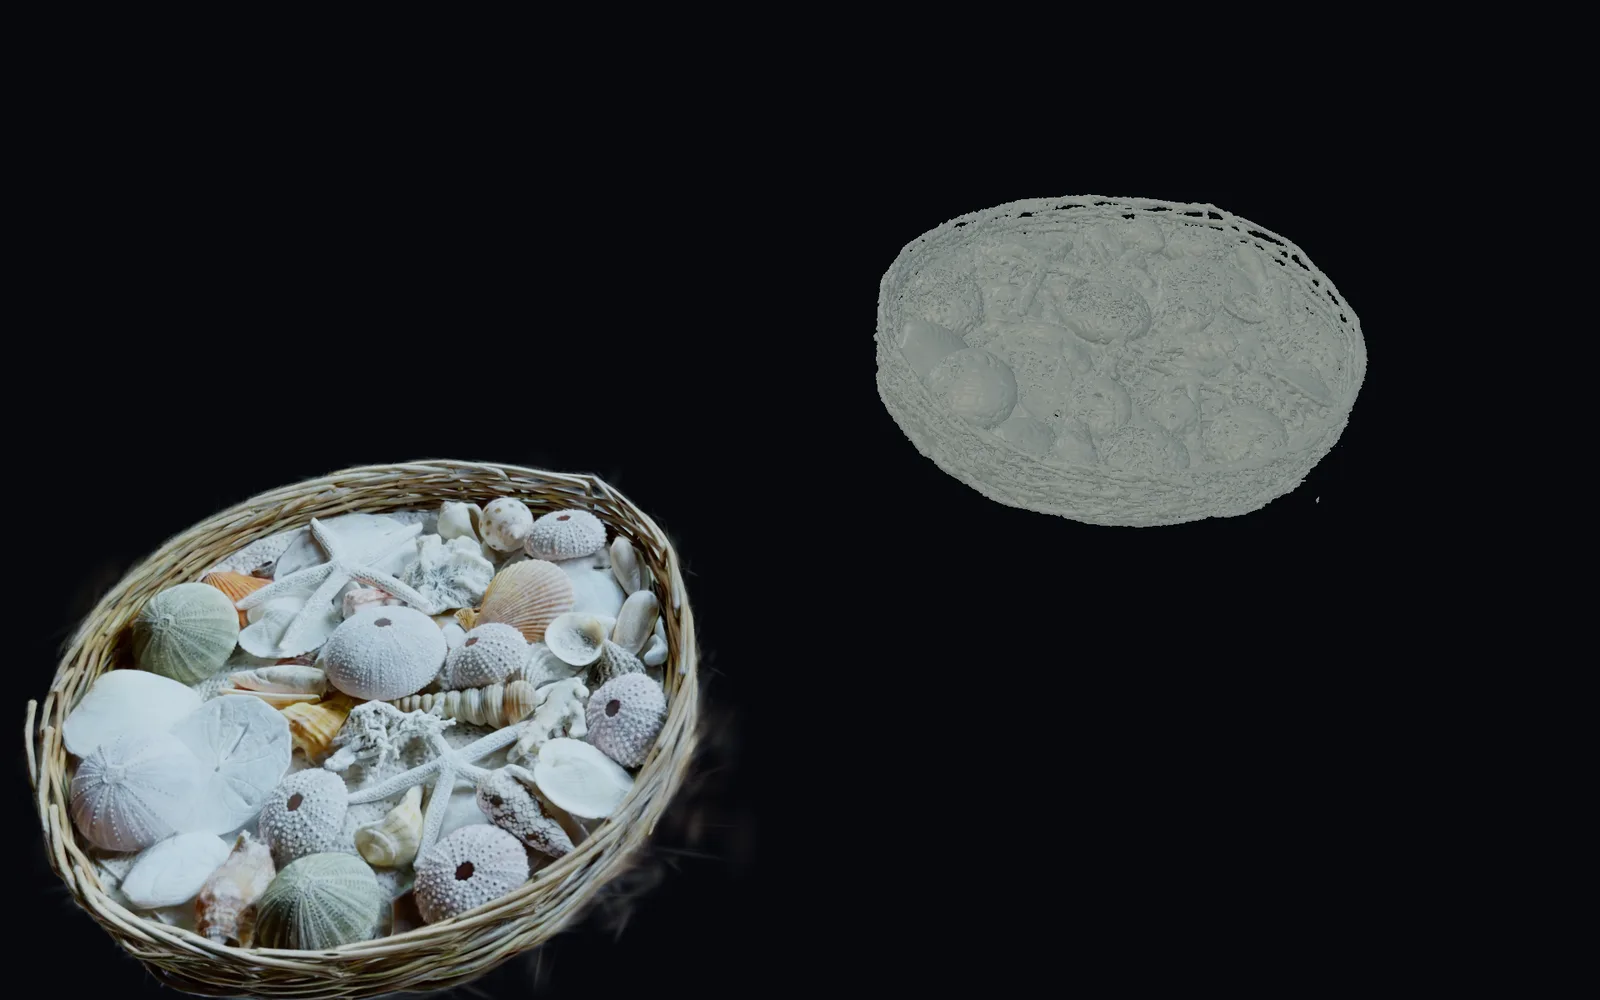
a scanned basket of shells beside the solid built from it · scan by Marc (superspl.at), CC BY 4.0
How it fits

Files, gear and code.

Tables, sensors, cameras and results come in and go out in the formats your lab already uses, and the whole thing can be driven from code.

Opens

CSV and JSON tables.csv.gz and .csv.zstAny text fileC3D motion capture: markers, analog channels, eventsBVH takesPLY point clouds and meshesOBJ, STL, glTF, FBX, USDSplats: PLY, SPZ, SOG, .splatCOLMAP camera solvesPNG, JPEG, TIFF, EXR, HDRImage sequencesMP4, MOV, MKV, WebM, AVIWAV, FLAC, MP3, OGG, AACSVG

Saves

CSV and JSONNDJSON from every output of a runPNG, JPEG and TIFF with print dpiEXR in full floatSVG drawingsImage sequencesH.264, H.265, ProResFFV1 lossless videoWAV, FLAC, AIFFPLY, OBJ, STL, glTF, USD, AlembicOSC captures: jsonl, csv, osc

Lab gear and protocols

Serial: sensors on dev boards, a lab balanceOSC and OSCQueryHTTP calls and webhooksWebSocket server and clientWebcams and capture cardsOrbbec depth cameras: color, depth, IRScreen and window captureMIDI controllersGamepadsPhones: a touch page from the graphDMX, Art-Net and sACN lightsNDI in and out
Everything it works with →

Python inside the graph.

A node can be a Python class with your own ports, and a full API outside the graph opens files, changes settings and reads results. This one loads a numpy file and hands the graph a table.

import numpy as np
import kinematic

class LoadTrial(kinematic.node.PythonScriptNode):
    type_name = "LoadTrial"
    memo = "source"   # runs once on its own when the graph starts
    outputs = [kinematic.node.PortDecl.typed_data("Table_Out")]

    def execute(self, ctx):
        a = np.load("trial_07.npy")   # t, x, y, z for each sample
        table = {c: a[:, i].tolist() for i, c in enumerate("txyz")}
        ctx.post_output(0, kinematic.values.Value.typed_data(table))
  • kinematic pip installadds the packages you already use to the app's own Python
  • kinematic repl --grapha Python prompt with no window, bound to a graph you can start, change and read
  • kinematic py-testruns a Python test suite against your graphs
Python in Kinematic →

Run it with no window.

The file you build in the app runs from a terminal, over SSH or on a lab machine with no screen. Sweep a setting, run once per file, and keep every value that came out.

$ kinematic run trial.kin --sweep noise.seed=1,2,3 --jobs 3
$ kinematic run trial.kin --clock virtual --frames 600
$ kinematic run study.kin --relay-dir out/ --until-dead
$ kinematic test study.kin --expect-output "done"
  • --sweeponce per value, every combination, each run its own process
  • --clock virtualthe same work at the same timestamps, repeatable on the same graphics card and driver
  • --relay-direvery output into a folder: pictures as files, channels and tables as NDJSON
  • --offlinesealed off the network: no model downloads, no pip. Models you already have still run
  • testchecks what came out, with a JSON report and an exit code for CI
Render from the terminal →
Where to start

Tutorials and demos.

Short lessons that each end with something finished, and demos that come with the app. Take one apart and keep the parts you need.

Tutorials

Browse every demo →
Honest gaps

What it does not yet do.

Better to know now. Need one of these for your lab? Reach out.

  • No HDF5, NetCDF, Parquet or MATLAB filesTables open from CSV and JSON, compressed CSV included. Read other formats in a Python node with the package you already use.
  • No regression or significance testsTables roll up to means, medians, standard deviations and percentiles, and a scatter shows its correlation. Fit models in a Python node.
  • No axis titles on plotsPlots draw tick values, channel names and a legend, not a titled journal figure. Save the numbers and finish the figure in your plotting tool.
  • No Lab Streaming LayerEEG and other rigs that stream over LSL do not connect yet. Bring them in over OSC, serial or a WebSocket.
  • No DICOM or NIfTIMedical scans do not open. A Python node can build a volume from a numpy array.
  • No LAS, LAZ or E57Lidar point clouds open as PLY.
  • No Kinect or ZEDThese depth cameras are not supported yet. Orbbec cameras work, and so does a plain webcam with a depth model.
Your next study

Download Kinematic.

Free. No account, no license key, no seat count, so it can go on every machine in the lab. macOS, Windows, Linux and Raspberry Pi.

the same run from the side, a stretch of it in bright gold